Some services are discovered casually.
Others are searched for when a problem already exists.
Septic tank cleaning, siphoning, pozo negro services, and related environmental solutions often fall into the second category.
A customer may already know what they need.
They open Google and search:
“Siphoning services.”
“Septic tank cleaning.”
“Sipsip pozo negro near me.”
Or, if they already know the company:
“Soliman septic tank.”
For Soliman E.C. Environmental Solutions Inc., that created a clear digital opportunity.
The challenge was not simply generating more impressions.
It was making sure the business appeared when potential customers demonstrated real service intent, then turning that visibility into measurable action.
That became the foundation of the HUGS approach.
Soliman E.C. already had existing brand demand.
People were searching for combinations of the company name and its services, including terms such as “soliman septic tank,” “soliman ec,” and related branded phrases.
But relying only on people who already know the brand limits growth.
A stronger acquisition system also needs to reach the customer who knows the problem but not yet the provider.
That meant capturing searches such as:
The strategy therefore had to balance two different forms of demand:
Branded Demand
Customers already familiar with Soliman E.C.
Non-Branded Demand
Customers actively looking for the service but still deciding which provider to contact.
February’s keyword report showed this opportunity clearly. Its top converting search keywords included “siphoning services” with three conversions and “septic tank cleaning” with two conversions, both non-branded terms.
That meant Google Ads was doing more than protecting existing brand searches.
It had the potential to create new customer acquisition.
The first part of HUGS is Humans.
For Soliman E.C., that meant understanding the situation behind the search.
Someone looking for siphoning services may not want to spend hours researching providers.
The issue may already require attention.
They are looking for:
Availability.
Location coverage.
Credibility.
A clear service match.
An easy way to take action.
That makes search intent more valuable than raw traffic volume.
The campaign therefore needed to answer a more useful question than:
“How many clicks did we get?”
The stronger question was:
“Which searches, campaigns, and locations are producing actions that matter?”
That shift is important because a high-traffic campaign can still be inefficient.
And a lower-traffic campaign can generate significantly more business value.
Soliman E.C.’s Google Ads account used several campaign types with different roles.
Performance Max helped extend conversion-focused activity across Google’s advertising inventory.
Rather than depending only on traditional keyword search traffic, the campaign could use Google’s automated systems to identify additional opportunities.
Remarketing kept Soliman E.C. visible to people who had already interacted with the business.
Not every visitor converts immediately.
Remarketing gave the brand another opportunity to stay visible after that initial interaction.
Branded campaigns helped capture people already looking specifically for Soliman E.C.
These audiences typically have stronger familiarity and can represent lower-friction demand.
Non-branded campaigns helped reach customers searching for the service category instead of the company name.
This was strategically important because it expanded the addressable market beyond existing brand awareness.
Together, the campaigns created a broader acquisition path:
Need → Search → Discover Soliman E.C. → Reconnect → Convert
January established a strong baseline.
The account generated:
The top conversion-driving campaigns were Display Remarketing and Performance Max, while Angeles City became the dominant geographic market with 84.8 conversions.
Tarlac City followed with 16 conversions and San Fernando with 15.
The data immediately showed that demand wasn’t limited to one area.
That would become even clearer as the campaign evolved.
February generated:
Traffic volume fell significantly compared with January, while impressions actually increased.
The report also showed a different geographic distribution.
Angeles still led conversions at 37, followed by:
The most commercially interesting signal, however, came from the keyword data.
Non-branded phrases started producing conversions.
That demonstrated that Google Ads could introduce Soliman E.C. to people who weren’t already searching by brand name.
March became the strongest month in the January to May reporting period.
The account generated:
February had generated approximately 166.5 conversions at ₱42.34 per conversion in the March report’s comparison data.
That means March delivered approximately:
What makes this more interesting is that the campaign did not need more traffic to achieve it.
Yet conversions more than doubled.
That is one of the clearest lessons in this case study:
More traffic does not automatically mean more growth. Better conversion efficiency can matter much more.
The performance report shows Performance Max and Display Remarketing dominating conversion volume.
Performance Max generated roughly 190 conversions, with Display Remarketing contributing approximately 148 based on the campaign chart.
Together, these campaigns accounted for the overwhelming majority of the month’s conversions.
This is where the Growth System perspective becomes useful.
If a campaign type consistently produces more efficient conversion activity, the response should not simply be:
“Great month.”
The system should ask:
What changed?
Where did the conversions come from?
Which audience or campaign structure contributed?
Can that performance be repeated?
Every strong month should create a learning opportunity.
One of the strongest signals was the movement in conversion geography.
January had been heavily concentrated in Angeles.
By March, the leading conversion cities were:
San Fernando overtook Angeles as the strongest conversion location during the month.
That matters because growth was no longer dependent on one core geographic market.
Demand was appearing across several cities in Central and Northern Luzon.
This created opportunities to refine location targeting and eventually customize campaigns around stronger service markets.
Keyword performance also shifted.
In February, non-branded keywords such as “siphoning services” and “septic tank cleaning” led keyword conversion performance.
In March, branded “soliman septic tank” generated two conversions, while “siphoning services” generated another conversion.
This variation tells us that branded and non-branded demand were both relevant.
A connected search strategy needs both.
Branded campaigns help capture people already considering the company.
Non-branded campaigns introduce the business to people who only know the problem they need solved.
That creates a healthier acquisition mix than depending exclusively on existing brand recognition.
Google Ads itself increasingly uses automation and machine learning.
Performance Max is the clearest example.
The technology can help identify audiences, placements, combinations, and opportunities at a scale that manual campaign management alone cannot replicate.
But automation does not eliminate the need for human strategy.
The March performance is a good example.
An automated system can distribute advertising.
It still takes a strategist to interpret:
Why did conversions rise?
Why did geographic demand shift?
Which campaign is actually contributing?
Which keywords indicate new customer acquisition?
Should the budget mix change?
Technology helps generate and organize signals.
Human judgment turns those signals into business decisions.
That’s the HUGS principle:
Created by Humans.
Scaled by Growth Systems.
Fueled by AI.
A strong case study should not hide the periods where performance declined.
April is important precisely because the results changed.
The account generated:
Conversions dropped sharply compared with March, even though spend remained relatively similar at approximately ₱7.83K.
The cost per conversion increased more than fourfold.
This tells us something important:
A Growth System cannot assume yesterday’s winning configuration will continue working automatically.
Performance changes.
Audience behavior changes.
Campaign efficiency changes.
Automation changes.
Competition changes.
The system needs to detect those shifts quickly.
Even while overall efficiency declined, geographic data continued revealing new opportunities.
The strongest April conversion locations included:
Lipa entering the stronger conversion markets was particularly interesting because it expanded the demand picture into Batangas.
Again, this showed that the useful output of advertising was not just a conversion total.
It was market intelligence.
The campaign was revealing where demand existed.
May produced an even clearer diagnostic signal.
The account generated:
This was a significant efficiency decline.
The top converting locations were:
with smaller conversion contributions from Mariveles, Meycauayan, and Olongapo.
The correct conclusion is not to ignore May because March looked better.
The correct conclusion is:
The system was telling us something needed to change.
Performance marketing is not a straight line.
A useful Growth System should show both acceleration and friction.
March told us what could happen when campaign efficiency improved.
April and May told us that the account needed a new optimization cycle.
That could include reviewing:
The supplied reports establish the decline in campaign efficiency, but they do not definitively establish which one of these factors caused it. Those would require further diagnostic analysis.
That distinction matters.
Good performance marketing is not about forcing every report into a success story.
It’s about using the data to identify the next problem worth solving.
Across the January to May reports, the campaign recorded approximately:
That totals approximately:
across the five-month reporting period.
The strongest lesson, however, isn’t the cumulative number.
It’s the variation inside it.
March accounted for approximately 43% of the five-month conversion total.
That makes March an important benchmark for understanding what efficient campaign performance could look like.
Understand the customer behind the search.
Someone looking for environmental services often has an immediate and practical need.
Human strategy determines which services, locations, and search behaviors matter most.
Use Performance Max, Search, Remarketing, geographic targeting, conversion measurement, and continuous optimization as connected components rather than isolated campaigns.
The system connects:
Search Demand → Visibility → Remarketing → Conversion → Data → Optimization
Use Google’s automated campaign capabilities and performance data to identify conversion opportunities faster.
AI helps scale the system.
It does not remove the need for strategic judgment.
Together:
Created by Humans.
Scaled by Growth Systems.
Fueled by AI.
The Soliman E.C. case study demonstrates why businesses should not judge digital marketing only by clicks.
In March:
Traffic declined.
Conversions rose dramatically.
Cost per conversion improved.
Then in April and May:
Traffic and conversions declined.
Cost per conversion deteriorated.
If we looked only at click volume, we would miss the more important story.
The real question is:
How efficiently is the system turning demand into meaningful business actions?
That is the metric that should drive optimization.
For service businesses with high-intent customer searches, Google can become a powerful demand-capture channel.
But the system needs more than keywords.
Start by understanding how customers describe the problem.
Separate branded demand from new customer acquisition.
Track which locations actually convert.
Use remarketing to reconnect with interested audiences.
Let automated campaign types help expand opportunity, but monitor their actual contribution.
And do not assume that a strong month means the system is permanently solved.
The strongest Growth Systems keep learning.
Find what works.
Scale it.
Watch the data.
Diagnose the decline.
Improve the system again.
That is how paid advertising becomes more than campaign management.
It becomes a Growth System.
More clicks are not always the answer.
Your business may already have enough demand entering the funnel.
The real opportunity may be in:
targeting, conversion, follow-up, customer journey, or how the system works together.
Before increasing your marketing spend, find the gap.
“Knowing our company, Soliman E.C., was known for its traditional marketing, Emerge helped us to introduce and raise awareness digitally. They didn’t just helped us boost sales and engagements; instead, it became a meaningful partnership which developed the company and recognized its strengths in various locations.”
— Khryzelle Zuniga, Digital Marketing Specialist at Soliman E.C. Environmental Solutions Inc.
See what’s working, what’s disconnected, and where your next growth opportunity may be.
The supplied January to May 2026 reports cover Google Ads management, including Performance Max, Display Remarketing, branded Search, non-branded Search, geographic performance, keyword performance, and conversion optimization.
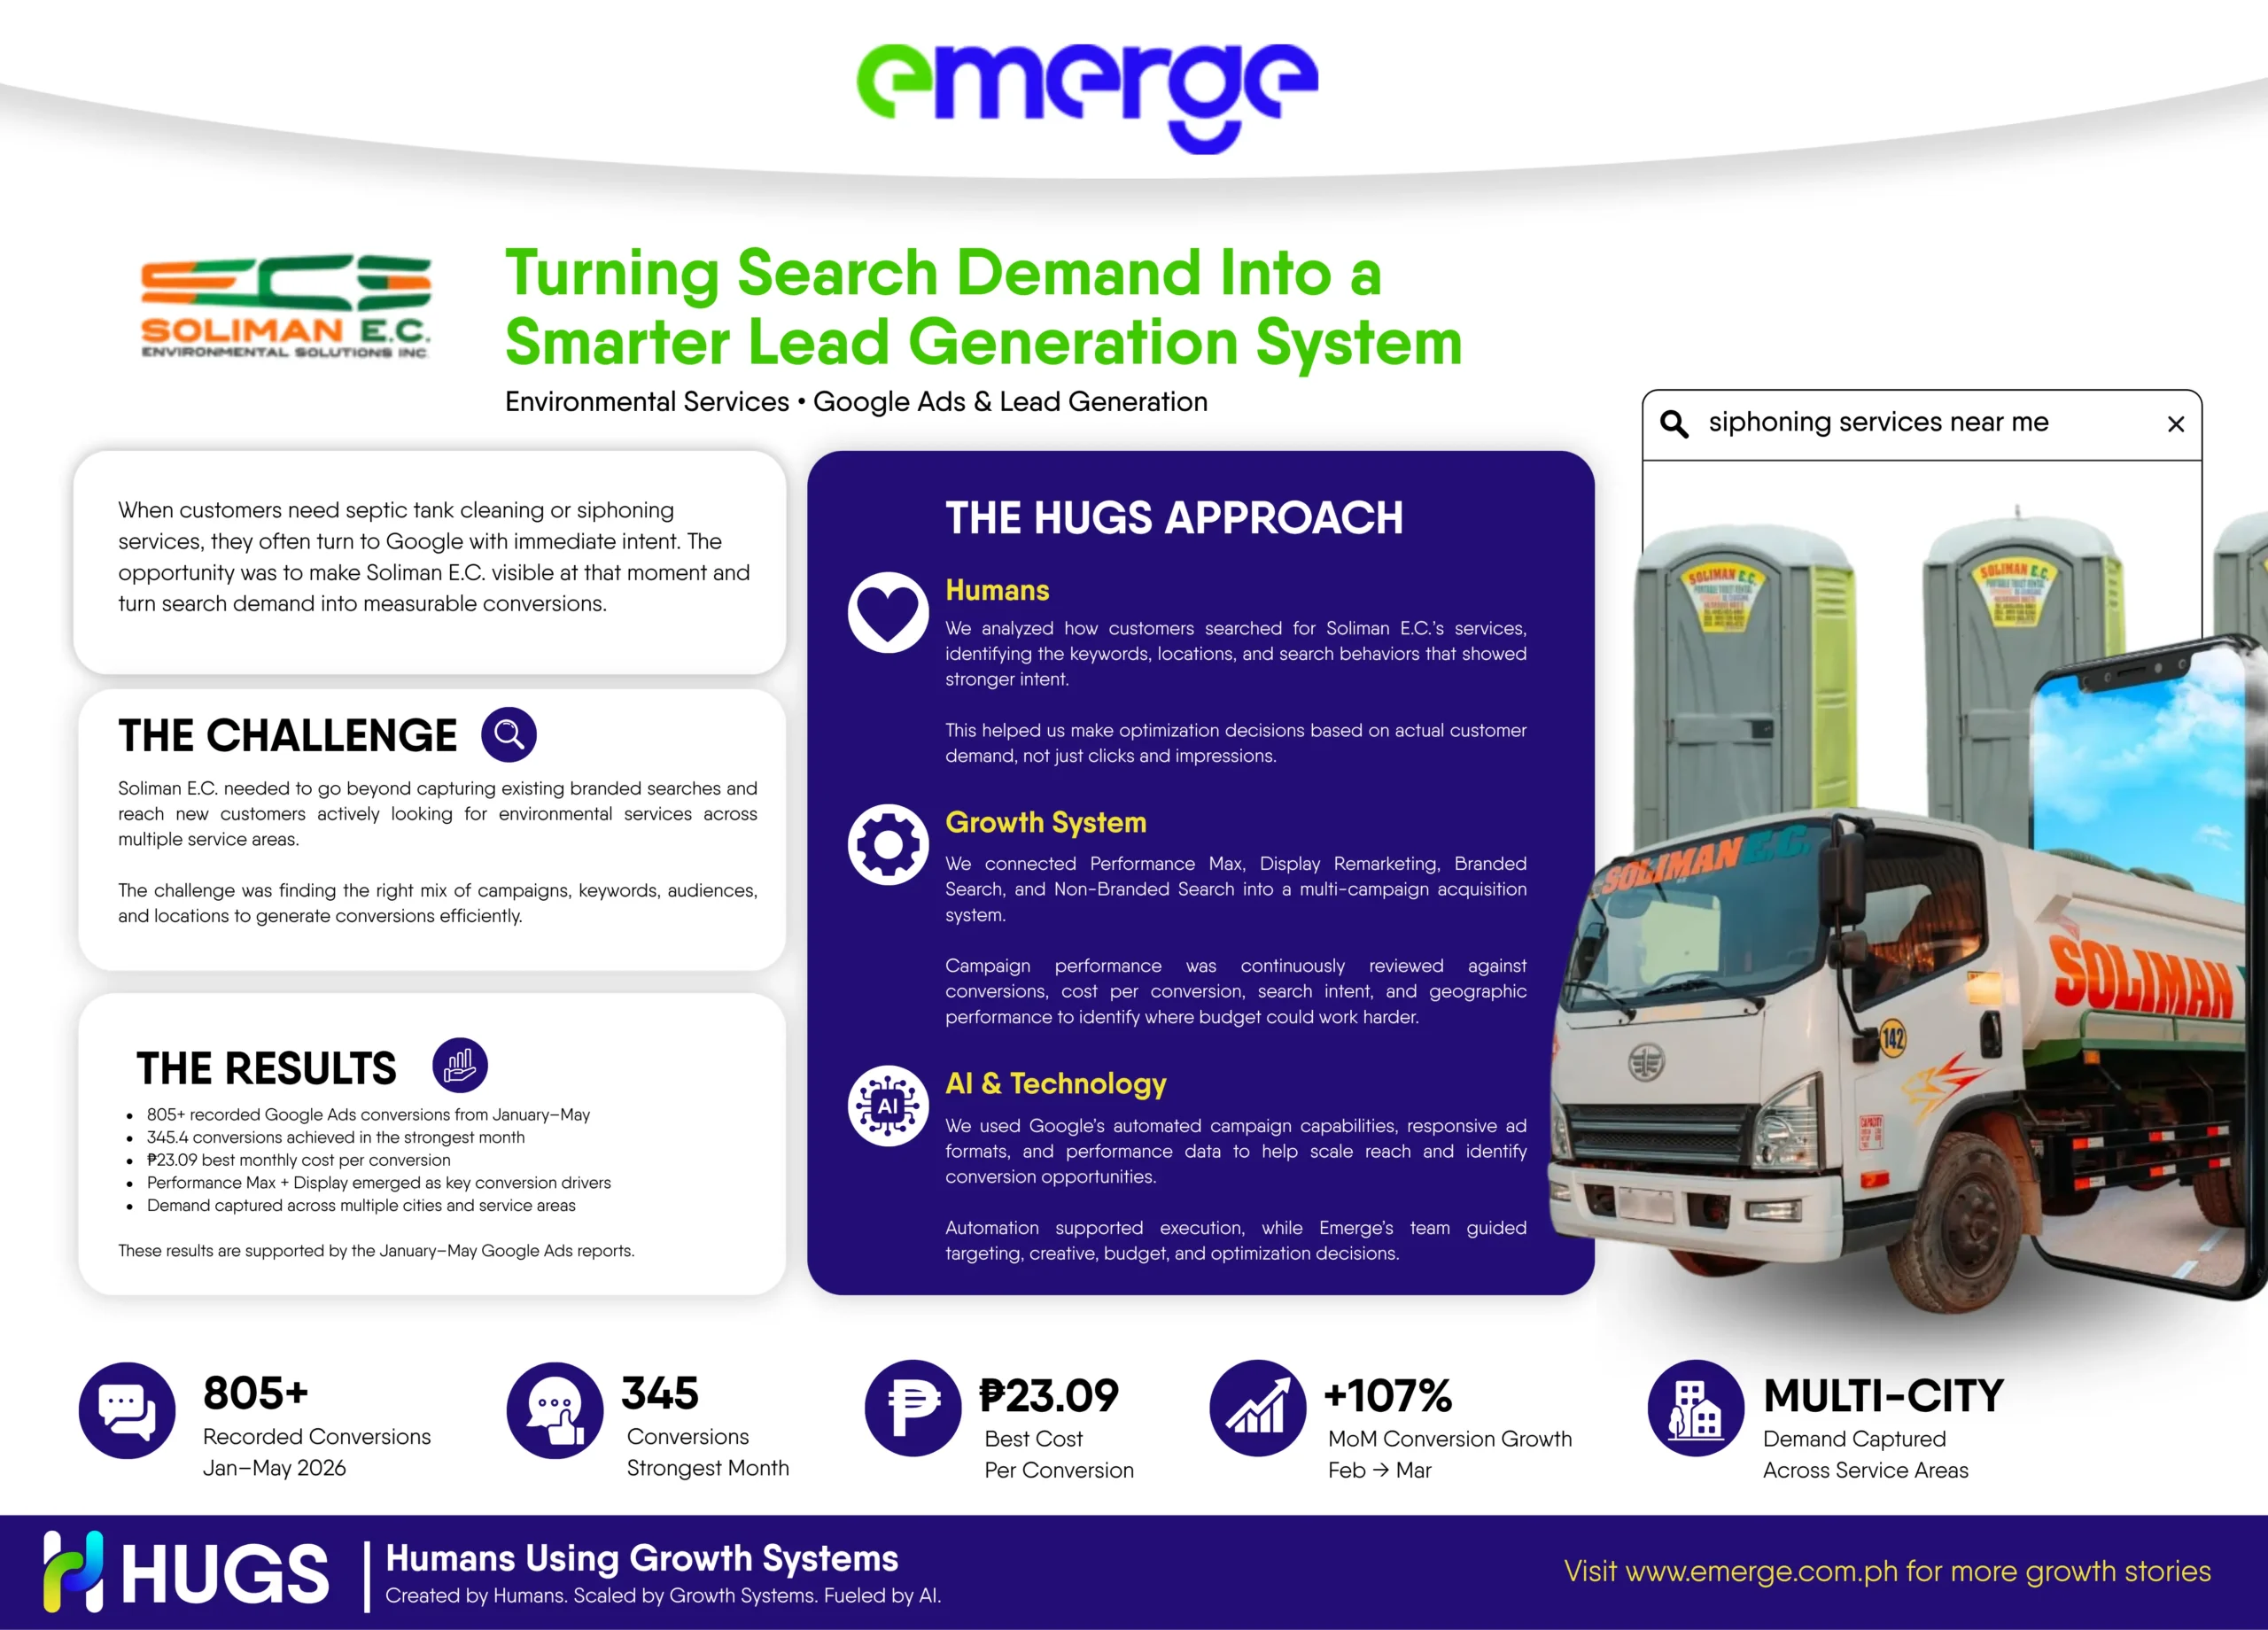
The monthly reports record approximately 805+ conversions from January through May 2026, with March contributing the largest monthly total at 345.4 conversions.
March 2026 was the strongest month in the supplied reporting period, generating 345.4 conversions at ₱23.09 per conversion. This was approximately 107% more conversions than February, while cost per conversion improved by roughly 45%.
Performance Max and Display Remarketing were the dominant conversion drivers during the strongest reporting periods. In March, the campaign chart shows both substantially outperforming Search campaigns in total recorded conversions.
The reports show conversions attributed to non-branded keywords. In February, “siphoning services” generated three conversions and “septic tank cleaning” generated two, showing demand from people searching by service rather than specifically by Soliman E.C.’s brand name.
The reports clearly show lower conversions and higher cost per conversion in April and May, but they do not establish one definitive cause. The decline signals the need to diagnose targeting, campaign structure, conversion tracking, creative, audience quality, landing experience, and other parts of the acquisition system before scaling spend further.

Typically replies within a day
Hello, Welcome to the site. Please check below button for chatting me through viber.